If you’re already investing, you know Section 80C of the Income Tax Act. But are you making the most of it?
Many investors simply park money in traditional options like PPF or tax‑saving FDs, missing out on the wealth‑creation potential of equities.
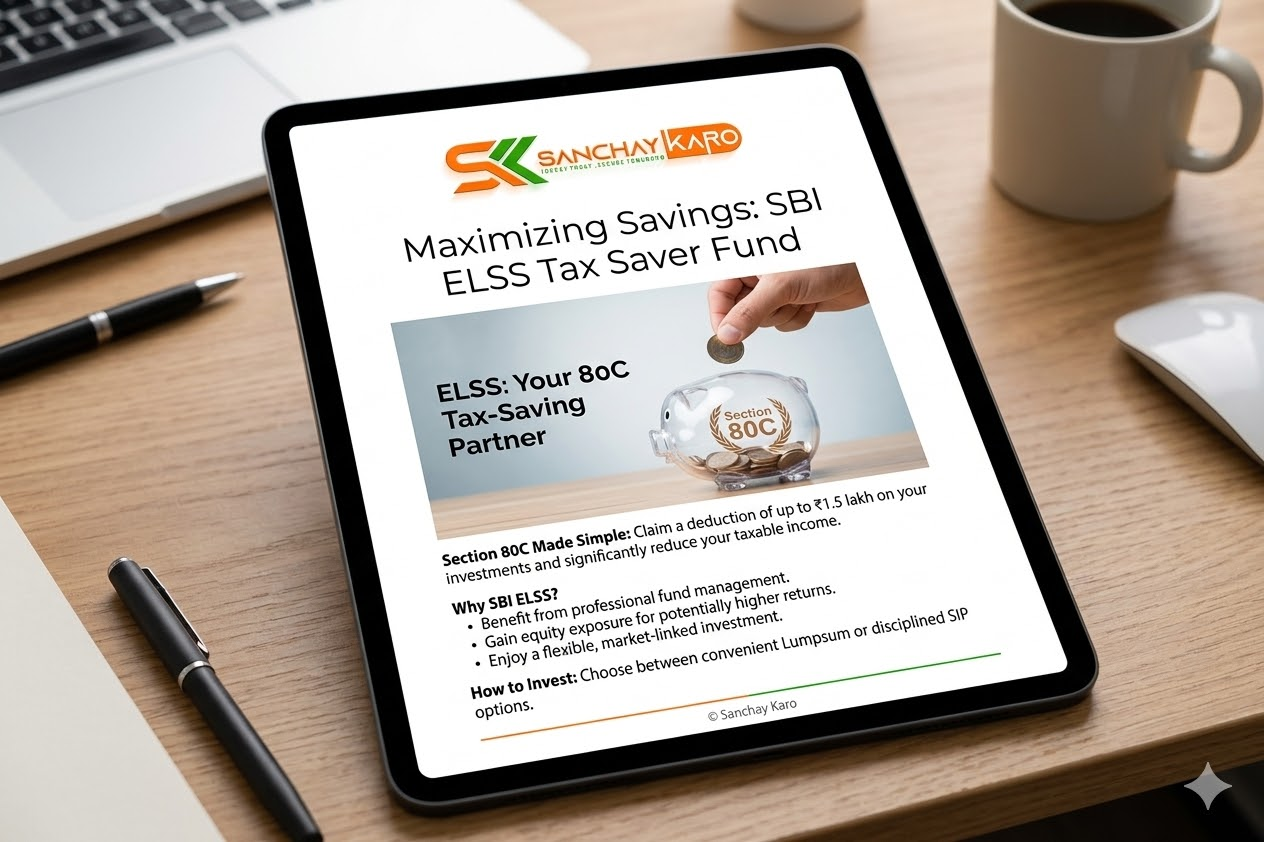
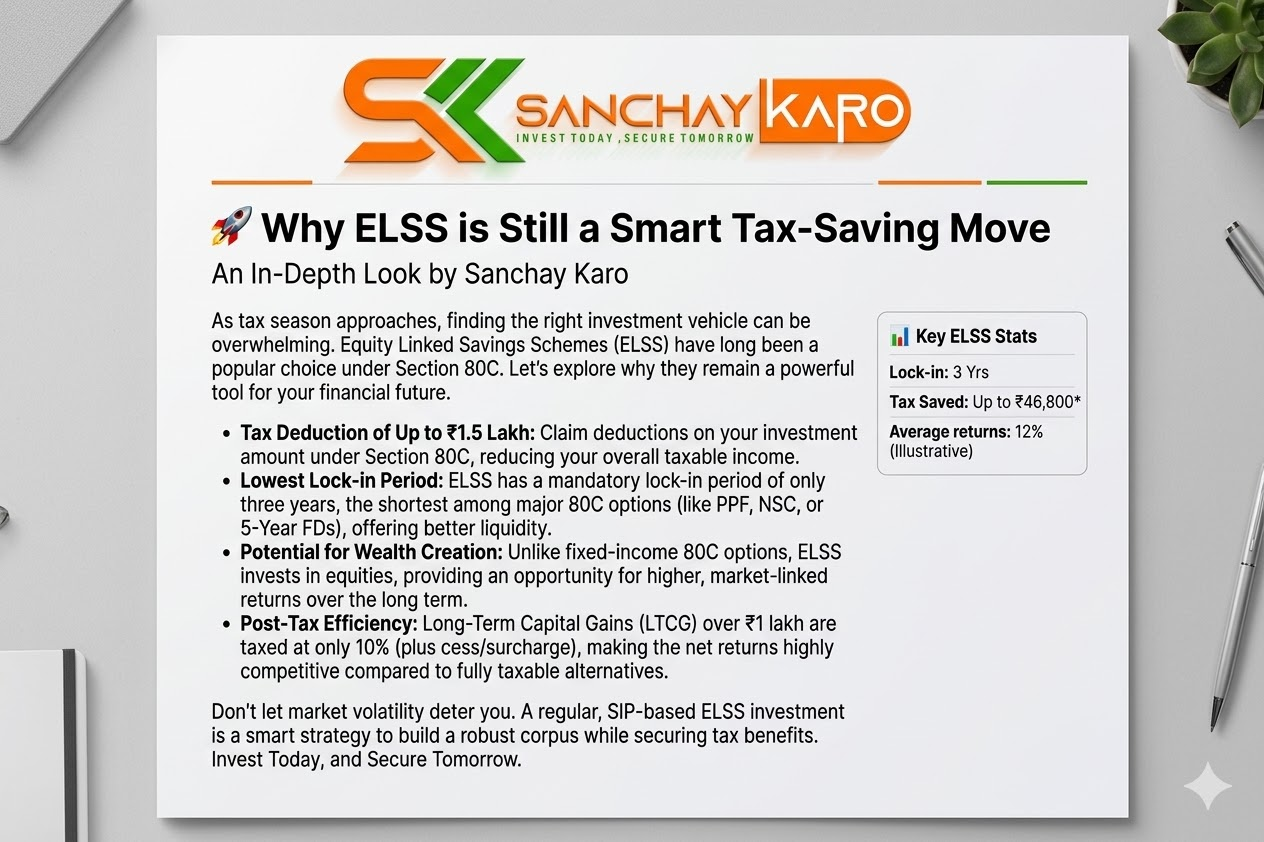
Enter ELSS – Equity Linked Savings Scheme. It’s the only 80C instrument that combines tax savings with the growth potential of the stock market. And with a lock‑in of just 3 years, it’s also the most flexible.
In this blog, we’ll break down what ELSS offers, and more importantly, we’ll compare five top ELSS funds using real data as of March 2026 – so you can make an informed choice.
🔹 What is ELSS?
ELSS is a category of mutual funds that invests at least 80% of its assets in equities. It is eligible for tax deduction under Section 80C, up to ₹1.5 lakh per financial year.
Unlike other tax‑saving instruments, ELSS comes with a market‑linked return profile, which means higher potential returns over the long term – albeit with higher risk.
🔹 Key Benefits at a Glance
| Benefit | Details |
|---|---|
| Tax Deduction | Up to ₹1.5 lakh under Section 80C |
| Lock‑in Period | 3 years – shortest among all 80C options |
| Return Potential | Historically 12–18% CAGR over long term (equity‑linked) |
| Investment Flexibility | SIP (systematic investment plan) or lump sum both allowed |
| Tax on Gains | LTCG up to ₹1.25 lakh/year exempt; beyond taxed at 12.5% |

🔹 Lock‑in Period: Why 3 Years Matters
When you compare 80C options, ELSS stands out for its shortest lock‑in:
- PPF – 15 years
- NSC – 5 years
- Tax‑saving FD – 5 years
- ELSS – 3 years
After 3 years, you can choose to redeem or continue holding. This liquidity edge makes ELSS ideal for younger investors or those who don’t want their money locked for decades.
🔹 Returns – Last 10 Years (Illustrative)
Over the past decade, top ELSS funds have delivered 12%–18% CAGR (though past performance does not guarantee future returns). Here are a few well‑known examples:
| Fund | 10‑Year Return (approx) |
|---|---|
| Quant ELSS | ~18–20% |
| Motilal Oswal ELSS | ~14–16% |
| Mirae Asset ELSS | ~16–17% |
| HDFC ELSS | ~14–15% |
But numbers vary by fund. Let’s now look at a real comparison of five prominent ELSS schemes as of March 2026.
📊 ELSS Fund Comparison (Data as on 21‑Mar‑2026)
We have analysed five funds based on data compiled by Pallab Routh, AMFI Registered Mutual Fund Distributor. The comparison covers returns, risk metrics, and investment values.
1. Basic Information
| Fund | Inception | AUM (₹ Cr) | NAV (₹) | TER (%) |
|---|---|---|---|---|
| Axis ELSS Tax Saver Reg Gr | 05‑Dec‑2009 | 33,612.94 | 87.78 | 1.54 |
| Canara Robeco ELSS Tax Saver Reg Gr | 05‑Feb‑2009 | 8,800.35 | 163.48 | 1.71 |
| Parag Parikh ELSS Tax Saver Reg Gr | 07‑Jul‑2019 | 5,720.76 | 28.74 | 1.72 |
| PGIM India ELSS Tax Saver Reg Gr | 11‑Dec‑2015 | 726.61 | 30.74 | 2.27 |
| SBI ELSS Tax Saver Fund Reg Plan Gr | 31‑Mar‑1993 | 32,168.89 | 406.34 | 1.57 |
Riskometer for all: Very High
2. Trailing Returns (as on 21‑Mar‑2026)
| Fund | 1 Yr | 3 Yrs | 5 Yrs | 10 Yrs |
|---|---|---|---|---|
| Axis ELSS | -1.75% | 13.66% | 7.49% | 11.87% |
| Canara Robeco ELSS | 2.42% | 13.93% | 11.61% | 14.62% |
| Parag Parikh ELSS | -2.80% | 13.67% | 14.24% | N/A* |
| PGIM India ELSS | -4.59% | 9.16% | 10.71% | 12.33% |
| SBI ELSS | 0.25% | 20.74% | 17.54% | 14.73% |
Parag Parikh ELSS inception in 2019, hence 10‑year data not available.
3. What ₹1 Lakh Lumpsum Would Have Grown To
| Fund | 1 Year | 3 Years | 5 Years | 10 Years |
|---|---|---|---|---|
| Axis ELSS | ₹98,254 | ₹1,46,889 | ₹1,43,535 | ₹3,07,358 |
| Canara Robeco ELSS | ₹1,02,425 | ₹1,47,919 | ₹1,73,288 | ₹3,92,038 |
| Parag Parikh ELSS | ₹97,201 | ₹1,46,942 | ₹1,94,679 | — |
| PGIM India ELSS | ₹95,407 | ₹1,30,089 | ₹1,66,432 | ₹3,20,208 |
| SBI ELSS | ₹1,00,246 | ₹1,76,114 | ₹2,24,592 | ₹3,95,699 |
4. SIP Returns (Monthly SIP of ₹5,000)
| Fund | 1 Year | 3 Years | 5 Years | 10 Years |
|---|---|---|---|---|
| Axis ELSS | ₹54,908 | ₹1,85,169 | ₹3,43,904 | ₹9,91,612 |
| Canara Robeco ELSS | ₹55,985 | ₹1,89,553 | ₹3,66,878 | ₹11,94,722 |
| Parag Parikh ELSS | ₹54,709 | ₹1,88,181 | ₹3,77,943 | — |
| PGIM India ELSS | ₹53,466 | ₹1,77,026 | ₹3,39,193 | ₹10,39,726 |
| SBI ELSS | ₹55,744 | ₹1,97,248 | ₹4,22,333 | ₹13,31,549 |
SIP returns are calculated using XIRR.
5. Risk Ratios (3‑Year Data)
| Fund | Std. Deviation | Sharpe Ratio | Sortino Ratio | Alpha | Beta |
|---|---|---|---|---|---|
| Axis ELSS | 12.29 | 0.85 | 1.47 | -0.64 | 0.89 |
| Canara Robeco ELSS | 12.09 | 0.88 | 1.43 | -0.97 | 0.93 |
| Parag Parikh ELSS | 9.56 | 1.00 | 1.77 | 0.90 | 0.70 |
| PGIM India ELSS | 11.86 | 0.56 | 0.89 | -4.36 | 0.89 |
| SBI ELSS | 12.86 | 1.36 | 2.59 | 5.42 | 0.97 |
What these mean:
- Sharpe & Sortino – higher is better for risk‑adjusted returns.
- Alpha – positive indicates outperformance against benchmark.
- Beta – measures volatility relative to the market (<1 means lower volatility).
🔍 What the Comparison Tells Us
- SBI ELSS has delivered the highest 3‑year and 5‑year returns among the five, along with strong risk‑adjusted ratios (Sharpe 1.36, Sortino 2.59) and a positive alpha.
- Canara Robeco ELSS shows consistent long‑term performance with a 10‑year return of 14.62% and solid SIP growth.
- Parag Parikh ELSS (though newer) has delivered impressive 5‑year returns with the lowest beta (0.70), indicating relatively lower volatility.
- Axis ELSS and PGIM India ELSS have faced recent underperformance but have long histories.
Past performance is not a guarantee of future results. The choice of fund should align with your risk profile, investment horizon, and financial goals.
💡 Pro Tip: Start an ELSS SIP Today
You don’t need a large sum to begin. A monthly SIP of ₹5,000 can grow to over ₹13 lakh in 10 years (as seen with SBI ELSS) – while also saving tax every year.
Because of the 3‑year lock‑in, a SIP ensures that every instalment is locked for only 3 years from its investment date, giving you staggered liquidity.
⚠️ Remember
- ELSS is market‑linked and carries very high risk (as indicated by the riskometer).
- Returns are not guaranteed – past performance may or may not be sustained.
- Always read the Scheme Information Document (SID) and Key Information Memorandum (KIM) before investing.
- Consult with your Mutual Fund Distributor or Financial Advisor to ensure the fund matches your risk profile.
Data Source: Pallab Routh, AMFI Registered Mutual Fund Distributor. Data as on 21‑Mar‑2026. Returns less than 1 year are absolute; greater than 1 year are CAGR. SIP returns are XIRR. Mutual Fund investments are subject to market risks.
🚀 Why ELSS is Still a Smart Tax‑Saving Move- Ready to make your 80C investment work harder?
Talk to your advisor or start an ELSS SIP today with Sanchay Karo – combine tax savings with the power of equities.