Which Small Cap Fund Delivered the Best Returns?
Investing in Small Cap Funds is often compared to riding a roller coaster—high thrills, potential for great highs, but with a fair share of stomach-churning dips. However, for investors who stayed the course between January 2020 and March 2026, the journey has been exceptionally rewarding.
At Sanchay Karo, we believe in data-driven insights. We analyzed a lump sum investment of ₹10,00,000 made on January 1, 2020, across the top Small Cap funds, tracking its performance until March 24, 2026.
The results are in, and one fund has clearly emerged as the undisputed champion of this bull run.
The Top Performer: Nippon India Small Cap Fund
If you had invested ₹10 Lakhs in the Nippon India Small Cap Fund (Growth) at the start of 2020, your investment would have grown to a staggering ₹38,44,268 by March 2026.
That translates to an Absolute Return of 284.43% and an impressive XIRR of 24.13%.
This fund not only topped the charts in terms of wealth creation but also demonstrated why active management in the small-cap space can significantly outperform benchmarks.

Performance Comparison: The Numbers Speak
Here is how the top contenders stacked up against the Nifty 50 and traditional safe havens over the same 6-year period (Jan 2020 – Mar 2026):
| Scheme Name | Market Value (₹) | Absolute Return (%) | XIRR (%) |
|---|---|---|---|
| Nippon India Small Cap Gr | 38,44,268 | 284.43 | 24.13 |
| HDFC Small Cap Reg Gr | 31,23,212 | 212.32 | 20.06 |
| Kotak – Small Cap Gr | 30,35,790 | 203.58 | 19.51 |
| Axis Small Cap Reg Gr | 29,47,220 | 194.72 | 18.94 |
| SBI Small Cap Reg Gr | 27,91,443 | 179.14 | 17.91 |
| NIFTY 50 TRI (Benchmark) | *20,19,731* | *101.97* | *11.94* |
| PPF (Safe Haven) | *15,35,994* | *53.6* | *7.13* |
| Fixed Deposit | *14,35,308* | *43.53* | *5.97* |
Key Takeaway: While the Nifty 50 doubled your money (101.97%), the Nippon India Small Cap Fund nearly quadrupled it. This highlights the immense potential of small caps during a growth cycle when chosen wisely.
SIP Analysis: The Power of Discipline
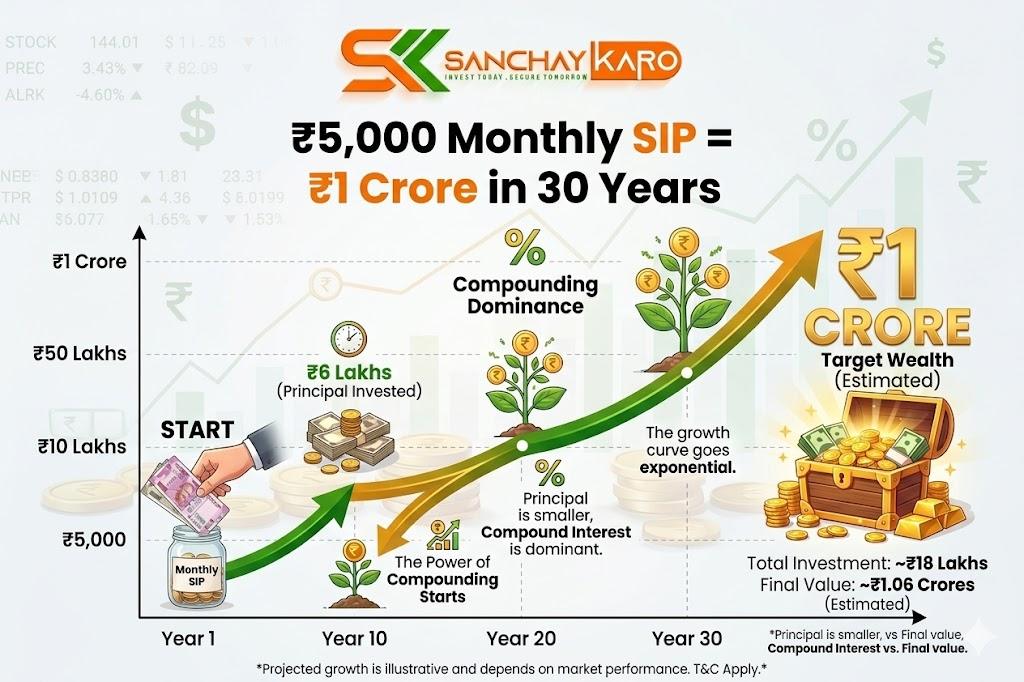
Not everyone has a lump sum to invest. For those who prefer the Systematic Investment Plan (SIP) route, we analyzed a monthly SIP of ₹5,000.
The results for the Nippon India Small Cap Fund are equally compelling:
- 5 Years: ₹4,05,331
- 10 Years: ₹16,21,856
This consistency shows that the fund has maintained its momentum across various market cycles, making it a strong candidate for long-term wealth creation.
Risk Ratios: Why Nippon India Stands Out
While returns are crucial, managing risk is paramount. Here’s a look at the risk metrics:
- Sharpe Ratio (0.94): This measures risk-adjusted returns. A higher Sharpe ratio is better. Nippon India Small Cap has the highest Sharpe Ratio among its peers, indicating it provides the best return per unit of risk taken.
- Alpha (1.97): This shows the fund manager’s skill in generating returns over the benchmark. Nippon India is one of the only two funds in the list with a positive Alpha, proving active management added value.
- Standard Deviation (16.77): While small caps are inherently volatile, Nippon India’s volatility is well-controlled compared to peers like Kotak (17.12), yet it delivered the highest returns.

Conclusion: Should You Invest?
The period from 2020 to 2026 was a golden era for equity markets, and Nippon India Small Cap Fund capitalized on it brilliantly. Its superior risk-adjusted returns, consistent SIP performance, and the highest absolute growth make it a top contender for investors looking to allocate to the small-cap category.
However, a word of caution: Small Cap funds are high-risk products. They are suitable only for investors with a high-risk appetite and a long investment horizon (7+ years).
Ready to Start Your Investment Journey?
At Sanchay Karo, we help you navigate the complexities of the market to find the right fit for your financial goals. Whether you want to invest in high-growth funds like Nippon India Small Cap or build a balanced portfolio, we are here to guide you.

*Mutual Fund investments are subject to market risks. Please read all scheme-related documents carefully. Past performance is not indicative of future returns. The data mentioned above is for the period Jan 1, 2020, to Mar 24, 2026, sourced from internal records. Investors should consult with their Mutual Fund Distributor or Financial Advisor before investing.*